Old Frameworks. Real Data. Better Answers.
The boring frameworks we all learned at university are quietly running some of the most valuable strategic work I do for clients right now. PESTLE. SWOT. The 4Ps. Stuff that has been in every business textbook for 30 years. Stuff most of us stopped thinking about the moment we got into the day to day of running campaigns and chasing results.
What has changed is not the framework. It is the speed. AI and connected data have collapsed the time it takes to run a proper strategic analysis from weeks to hours. But the framework is still what makes the data mean something. Without it you are just looking at numbers. With it you are looking at a story.
The Question That Started It
A client asked me recently why their ads were not performing. Spend was up. Impression share was up. Conversions were flat.
We started digging into the account. Then the conversation widened.
It was not just the ads. SEO leads were down. Referrals were softer. Direct enquiries had dropped off. Even the offline channels that had been consistent for years, word of mouth, repeat customers, walk ins were quieter than they should have been.
Every channel that normally worked was underperforming at the same time.
That is not an ads problem. That is a market problem. And the only way to see it clearly was to step back, pull all the data together and run it through a framework designed exactly for this kind of question.
What I Actually Did
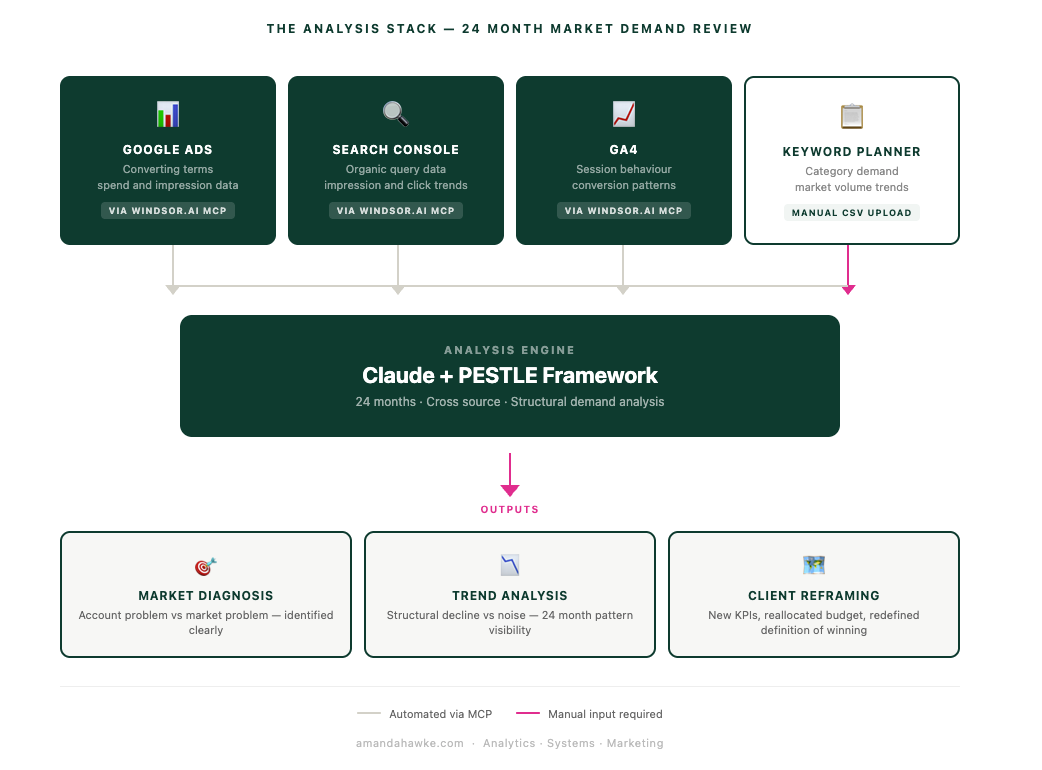
I pulled 24 months of cross source data through Windsor.ai's MCP including Google Ads, Search Console and GA4, directly into Claude, layered in keyword market data manually from Google Keyword Planner, then ran the whole picture through a PESTLE analysis.
The account was not the problem. The market was.
Top converting search terms were down substantially year on year. Category defining queries were contracting even faster. Independent industry data confirmed a multi year structural decline in demand. The traffic profile had shifted entirely and no amount of bid optimisation was going to bring it back.
The PESTLE overlay explained why. Sustained interest rates deferring discretionary spend. Cost of living shifting purchasing behaviour. Environmental factors collapsing seasonal demand windows. AI overviews consuming organic traffic that had been reliable for years. Regulatory and platform changes forcing structural rebuilds across the category.
That reframed the entire client conversation. Different KPIs. Different budget allocation. A completely different definition of what winning looks like for the next 12 months.
That is a very different conversation than "your ads are underperforming."
Why 24 Months and Not 12
Most people pull 30 or 90 days when something looks wrong. Some pull 12 months. Almost nobody pulls 24.
Twelve months of data cannot distinguish between noise and a structural shift. A bad quarter looks identical to the beginning of a multi year decline if you are only looking at one year. Two years gives you the pattern. It shows you whether something is recovering, plateauing or in sustained decline and that distinction determines everything about what you recommend next.
It also gives you real seasonality context. A business that always dips in winter looks very different with 24 months of data than it does with six. Before you tell a client something is wrong you need to know whether it was also wrong this time last year.
The Process Step by Step
This is exactly how I ran it. You can apply this to any account with 24 months of data available.
Connect Your Sources
Windsor.ai's MCP connects Google Ads, Search Console and GA4 in one place. About five minutes per connector, no code, no SQL, no manual exports. Once connected, Claude can query across all three sources in a single conversation.
Set Your Window to 24 Months Minimum
Pull everything for the full two year period before you start analysing anything. Resist the urge to start with a shorter window — you will anchor to the wrong baseline and the analysis will mislead you.
Start With Converting Terms Not Spending Terms
Pull the top 20 converting search terms for the last 12 months. Then pull the exact same terms for the previous 12 months. The delta between those two periods tells you whether intent has shifted or evaporated entirely. This is your first real signal and it is usually the most revealing one.
Cross Reference With Search Console
Are the same queries declining organically? If yes it is likely market wide, not a channel specific problem. If organic is holding while paid declines, the problem is inside the account. Knowing which it is determines where you focus your energy and your client's budget.
Add Keyword Planner Data Manually
Windsor.ai's MCP does not pull Keyword Planner data directly so export it yourself and upload the CSV into Claude. Pull 24 months with the correct locations selected. Bad location data produces bad volume data and that poisons the entire analysis. This step is what separates a channel performance review from a genuine market demand analysis.
Layer In GA4 Behaviour Data
Are session durations up but conversions down? That is research not buy behaviour. People are investigating but not committing. That is a different problem than low traffic and it needs a different fix, usually trust signals, social proof or a longer nurture sequence rather than more ad spend.
Run the PESTLE Analysis
Ask Claude to map each force to the data shifts you have identified. Political, Economic, Social, Technological, Legal, Environmental. The instruction matters here, ask for concrete mappings not generic observations. "Economic conditions are challenging" is useless. "Sustained OCR rates above 5% have deferred discretionary spend in this category by an estimated 20 to 30% based on the keyword volume data" is actionable.
Bring It to the Client as a Reframing Not a Report
Here is what you are seeing. Here is what the data shows is actually happening. Here is what winning looks like for the next 12 months given the new reality. That is the document you take into the room. Not a deck full of charts. A clear reframing of the situation and what to do about it.
Where the Planning Layer Comes In
Once you can see the decline month on month and year on year you can plan against it instead of fighting it.
If the market is contracting 30% you need to be 30% more present just to stand still. If a specific channel is contracting faster than others you reallocate — not just optimise. Optimising a declining channel is rearranging deck chairs. Reallocating budget toward where conversion intent still exists is strategy.
Layering the client's own business data over the top of the market picture — average order value, seasonal cycles, margin by service line, conversion patterns by channel — gives you the actual plan.
The questions become: where do we widen scope because existing channels are shrinking? Where do we double down because conversion opportunity is still strong and we just need more frequency and more share of voice? Where do we accept lower volume and protect margin? Where do we test something new because the old playbook no longer fits?
In a contracting market you cannot out optimise the trend. You can be more present, more often, in the places where conversion intent still exists. And you can stop pouring budget into places where demand has structurally moved on.
The Prompt
Here is exactly what I used inside Claude. Take it, adapt it to your client and run it this week.
You are a marketing strategist. I have connected 24 months of data from Google Ads, Search Console and GA4 via Windsor.ai's MCP. I have also exported keyword market data from Google Keyword Planner for the same period and uploaded it as a CSV.
Run the following analysis and present it as a reframing document I can take to my client:
Identify the top 20 converting search terms across the last 12 months. Compare them to the same terms in the previous 12 months. Flag any with significant volume or conversion decline.
Use the uploaded Keyword Planner CSV to compare category level search demand across the 24 month window. Identify whether the decline is client specific or market wide.
Cross reference Search Console organic queries to see if the same patterns appear in non paid traffic.
Pull GA4 session behaviour data. Flag if session duration is up but conversions are down.
Run a full PESTLE analysis over the findings. For each force — Political, Economic, Social, Technological, Legal, Environmental — map specific data shifts to specific external factors. Be concrete, not generic.
Conclude with a reframing section: what the client thinks is happening versus what the data shows is actually happening, and what winning should look like for the next 12 months given the new reality.
Finish with a planning layer: which channels to widen, which to double down on, which to accept lower volume on and which to test new approaches in.
The Takeaway
The new tools do not replace strategy work. They make it fast enough to actually do properly.
The ability to pull 24 months of cross source data, run it through a structured framework and arrive at a client ready reframing document in a single working session is genuinely new. That used to take a team of analysts and two weeks. Now it takes one person, the right tools and a framework that has been sitting in a textbook since the 1960s
The frameworks were never the problem. Time was. That problem is solved.
If you want to talk through how to run this kind of analysis for your own business or your clients, get in touch at hello@amandahawke.com.